Customizable Non-Repainting HTF MACD MFI Scalper Bot Strategy v2Customizable Non-Repainting HTF MACD MFI Scalper Bot Strategy v2
This script was originally shared by Wunderbit as a free open source script for the community to work with. This is my second published iteration of this idea.
WHAT THIS SCRIPT DOES:
It is intended for use on an algorithmic bot trading platform but can be used for scalping and manual trading.
This strategy is based on the trend-following momentum indicator . It includes the Money Flow index as an additional point for entry.
This is a new and improved version geared for lower timeframes (15-5 minutes), but can be run on larger ones as well. I am testing it live as my high frequency trader.
HOW IT DOES IT:
It uses a combination of MACD and MFI indicators to create entry signals. Parameters for each indicator have been surfaced for user configurability.
Take profits are now trailing profits, and the stop loss is now fixed. Why? I found that the trailing stop loss with ATR in the previous version yields very good results for back tests but becomes very difficult to deploy live due to transaction fees. As you can see the average trade is a higher profit percentage than the previous version.
HOW IS MY VERSION ORIGINAL:
Now instead of using ATR stop loss, we have a fixed stop loss - counter intuitively to what some may believe this performs better in live trading scenarios since it gives the strategy room to move. I noticed that the ATR trailing stop was stopping out too fast and was eating away balance due to transaction fees.
The take profit on the other hand is now a trailing profit with a customizable deviation. This ensures that you can have a minimum profit you want to take in order to exit.
I have depracated the old ATR trailing stop as it became too confusing to have those as different options. I kept the old version for others that want to experiment with it. The source code still requires some cleanup, but its fully functional.
I added in a way to show RSI values and ATR values with a checkbox so that you can use the new an improved ATR Filter (and grab the right RSI values for the RSI filter). This will help to filter out times of very low volatility where we are unlikely to find a profitable trade. Use the "Show Data" checkbox to see what the values are on the indicator pane, then use those values to gauge what you want to filter out.
Both versions
Delayed Signals : The script has been refactored to use a time frame drop down. The higher time frame can be run on a faster chart (recommended on one minute chart for fastest signal confirmation and relay to algotrading platform.)
Repainting Issues : All indicators have been recoded to use the security function that checks to see if the current calculation is in realtime, if it is, then it uses the previous bar for calculation. If you are still experiencing repainting issues based on intended (or non intended use), please provide a report with screenshot and explanation so I can try to address.
Filtering : I have added to additional filters an ABOVE EMA Filter and a BELOW RSI Filter (both can be turned on and off)
Customizable Long and Close Messages : This allows someone to use the script for algorithmic trading without having to alter code. It also means you can use one indicator for all of your different alterts required for your bots.
HOW TO USE IT:
It is intended to be used in the 5-30 minute time frames, but you might be able to get a good configuration for higher time frames. I welcome feedback from other users on what they have found.
Find a pair with high volatility (example KUCOIN:ETH3LUSDT ) - I have found it works particularly well with 3L and 3S tokens for crypto. although it the limitation is that confrigurations I have found to work typically have low R/R ratio, but very high win rate and profit factor.
Ideally set one minute chart for bots, but you can use other charts for manual trading. The signal will be delayed by one bar but I have found configurations that still test well.
Select a time frame in configuration for your indicator calculations.
Select the strategy config for time frame (resolution). I like to use 5 and 15 minutes for scalping scenarios, but I am interested in hearing back from other community memebers.
Optimize your indicator without filters : customize your settings for MACD and MFI that are profitable with your chart and selected time frame calculation. Try different Take Profits (try about 2-5%) and stop loss (try about 5-8%). See if your back test is profitable and continue to optimize.
Use the Trend, RSI, ATR Filter to further refine your signals for entry. You will get less entries but you can increase your win ratio.
You can use the open and close messages for a platform integration, but I choose to set mine up on the destination platform and let the platform close it. With certain platforms you cannot be sure what your entry point actually was compared to Trading View due to slippage and timing, so I let the platform decide when it is actually profitable.
Limitations: this works rather well for short term, and does some good forward testing but back testing large data sets is a problem when switching from very small time frame to large time frame. For instance, finding a configuration that works on a one minute chart but then changing to a 1 hour chart means you lose some of your intra bar calclulations. There are some new features in pine script which might be able to address, this, but I have not had a chance to work on that issue.
Cari dalam skrip untuk "the script"

Customizable Non-Repainting HTF MACD MFI Scalper Bot StrategyThis script was originally shared by Wunderbit as a free open source script for the community to work with.
WHAT THIS SCRIPT DOES:
It is intended for use on an algorithmic bot trading platform but can be used for scalping and manual trading.
This strategy is based on the trend-following momentum indicator . It includes the Money Flow index as an additional point for entry.
HOW IT DOES IT:
It uses a combination of MACD and MFI indicators to create entry signals. Parameters for each indicator have been surfaced for user configurability.
Take profits are fixed, but stop loss uses ATR configuration to minimize losses and close profitably.
HOW IS MY VERSION ORIGINAL:
I started trying to deploy this script myself in my algorithmic trading but ran into some issues which I have tried to address in this version.
Delayed Signals : The script has been refactored to use a time frame drop down. The higher time frame can be run on a faster chart (recommended on one minute chart for fastest signal confirmation and relay to algotrading platform.)
Repainting Issues : All indicators have been recoded to use the security function that checks to see if the current calculation is in realtime, if it is, then it uses the previous bar for calculation. If you are still experiencing repainting issues based on intended (or non intended use), please provide a report with screenshot and explanation so I can try to address.
Filtering : I have added to additional filters an ABOVE EMA Filter and a BELOW RSI Filter (both can be turned on and off)
Customizable Long and Close Messages : This allows someone to use the script for algorithmic trading without having to alter code. It also means you can use one indicator for all of your different alterts required for your bots.
HOW TO USE IT:
It is intended to be used in the 5-30 minute time frames, but you might be able to get a good configuration for higher time frames. I welcome feedback from other users on what they have found.
Find a pair with high volatility (example KUCOIN:ETH3LUSDT ) - I have found it works particularly well with 3L and 3S tokens for crypto. although it the limitation is that confrigurations I have found to work typically have low R/R ratio, but very high win rate and profit factor.
Ideally set one minute chart for bots, but you can use other charts for manual trading. The signal will be delayed by one bar but I have found configurations that still test well.
Select a time frame in configuration for your indicator calculations.
Select the strategy config for time frame. I like to use 5 and 15 minutes for scalping scenarios, but I am interested in hearing back from other community memebers.
Optimize your indicator without filters (trendFilter and RSI Filter)
Use the TrendFilter and RSI Filter to further refine your signals for entry. You will get less entries but you can increase your win ratio.
I will add screenshots and possibly a video provided that it passes community standards.
Limitations: this works rather well for short term, and does some good forward testing but back testing large data sets is a problem when switching from very small time frame to large time frame. For instance, finding a configuration that works on a one minute chart but then changing to a 1 hour chart means you lose some of your intra bar calclulations. There are some new features in pine script which might be able to address, this, but I have not had a chance to work on that issue.

The Impossible TraderTHE IMPOSSIBLE TRADER
A simple, but effective High Freq Strategy script based on MACD or RSI trend, with extra customizable Alert Messages for Bots.
WHAT IT DOES
This script (works best at lower TimeFrames) just follow the trend of MACD or RSI on your asset.
Why it should work? Because in an upper trend, there are more chance of green candles than reds. And in dump trend there are more chance of red candles than greens.
While trend is positive, it will try to open Long orders as fast as possible at market price.
While trend is negative, it will try to open Short orders as fast as possible at market price.
HOW TO SETUP YOUR PREFERENCES
Capital : Insert a % of Margin you want to use for your positions (usually 30% is quite good)
Leverage : Choose leverage based on your plans
Trail Tick @ : This value (in Tick) tell the script "when" the "Trail Stop" order must be activated (from the Entry price)
Offset Tick @ : This is the price (in Tick) from the Trail Stop Price activated. Basically it is a Stop Loss that follow the price at a fixed distance.
SL Tick @ : Set a Stop Loss at amount Tick distance from the Entry Price. (Let's call it a Safety Stop Loss for bad decisions...)
TP Tick @ : Set a Take Profit at amount Tick distance from the Entry Price. Sometimes is better to exit in full Gain than keep positions.
Strategy : You can choose a Only Long, Only Short or Long+Short sametime strategy.
with MACD or RSI : You can try the strategy applied on MACD or applied on customizable RSI EMA
EMA : If you choosed RSI EMA, you can set any value for your testing (usually 80-120 works very nice)
Exit order after bars : Some Exchanges / Brokers apply fixed cost, and a strategy too fast could not be productive. This set will let you to delay the Exit Order on already Opened positions.
Keep Stop Loss active : If you are planning a delay for Exit Orders, sometime could be useful to keep activated Stop Loss.
Strategy Preset : Some preset I've found interesting, with good results.
BackTest Days : If there are too many results and script doesn't work, you can choose a closer range to show results.
EXTRA FEATURES
On Screen Display : OSD will show you some realtime stats about your strategy, like Asset Tick, Trading Period Range, Drawdown, Gains and not closed trade.
Alert Message : You can enter custom Long Entry/Exit and Short Entry/Exit message for your Bots (like AutoView, WunderBit, etc...). When alert is triggered, you can send custom message with {{strategy.order.comment}} in the text field
AutoView Alert Message : If you are user of AutoView, you can generate your calls. Those are tested only on Oanda with index like Sp500, US100, Us30.
TIPS ON USE
Some asset on TradingView require an higher initial capital. Go to this Script Settings -> Properties and rise Initial Capital.
Be aware of commissions and spread when evalutating a strategy. Go to this Script Settings -> Properties and set Commission and Slippage
Trail Stop and Ticks could be difficult to understand, but very profitable. Please take your time and study how it works.
Consider Tick like the minimum movement your asset can do. Ticks occurs "intra-bar", so some of your positions could be closed almost instantly.
Consider Trail Stop like a Stop Loss that keep always the same distance from your positions, but never came back . If you are in gain, say of 10 Ticks, and your Trail have 5 Ticks, this means for sure a close at minimum 5 Ticks from Entry Price.
On Screen Display will show you Ticks for your asset. This will help you on strategy settings, because not all asset responds on the same way.
ONLY LONG EXAMPLE
ONLY SHORT EXAMPLE

hammerCandle & starCandleIn this scrip we have combine Pinbar Candlesticks calculated using Fibonacci, the bullish hammer candlestick and bearish star candlestick with EMAs and ATR.
I have used 12 Hour time frame which works well EUR/USD, this script works well on higher time frames such as Daily, 12 hours etc.
I have used 1.5 times the ATR as the stop loss and 1 times the ATR as the take profit as these risk to reward ratio gives us the best results for the 12 hour time frame for EUR/USD. Past result are not a prove of performance of the future.
I have added 1 for slippage and 1 for commission.
This script contains AutoView syntax and is fully automated if you connect TradingView to AutoView and a broker, prefebly Oanda.
This script uses two exponential moving averages for trend detection and Average True Range , ATR for stop loss and take profit targets. All of these setting are adjustable.
We only trade with the trend if the 50 period exponential moving averages is above the 200 period exponential moving averages, if a hammer candle is formed for entry.
Likewise with sell trade if a star candle is formed for entry and if the 50 period exponential moving averages is below the 200 period exponential moving averages.
This script does not trail your stop loss as I have noticed it does not give me good results. Stop loss is a fix stop loss based on Average True Range and so is the profit target.
This script has risk management, it risk a certain percent of the inputted capital amount in the setting. See settings for more details.
Note: Due to auto risk management this script only works on Forex.
Green line is 50 period exponential moving averages and red line is the the 200 period exponential moving average . Blue line is stop loss for long trade and black line stop loss for short trade.
Please trade at your own risk, all the setting in the script are adjustable for you to test before trading.
Many Thanks,
Honet Trader
Bitlinc MARSI Study AST w/ Take Profit & Stop loss - beta 0.1This script is beta 0.1 - will update as soon as the script is tradable
This script is based on AST on a 10 minute timeframe. You can change the asset and the timeframe for any asset you want to trade, but for it to work correct ALL settings have to be testes in the Strategy section of the TradingView. Each assets and timeframe require a different mixture of settings. This is NOT a one settings fits all trading for all assets on any timeframe. Below are the settings and explanation on how it works.
How it fires a buy / sell:
The script will plot an RSI with upper and lower bands in a separate indicator window. The idea behind this script is to fire a LONG when MA crosses OVER lower band and fire a SHORT when the MA crosses under the lower band. Each order that fires is an OCO (Order Cancels Order) for pyramiding.
Settings:
You have full control of these settings as mentioned above, you must configure every part of this script for each asset and timeframe you trade.
- Length of MA
- Length
- Upper bands of RSI
- Lower bands of RSI
- Take profit percentage
- Stop loss percentage
- Month to start and end the strategy (within 2020)
- Day to start and end the strategy (within 2020)
- Quantity type
- Slippage
- Pyramiding
***Remember that after the signal to enter or exit a trade is fired, the alert will trigger AFTER the close of the candle that caused the tigger to fire

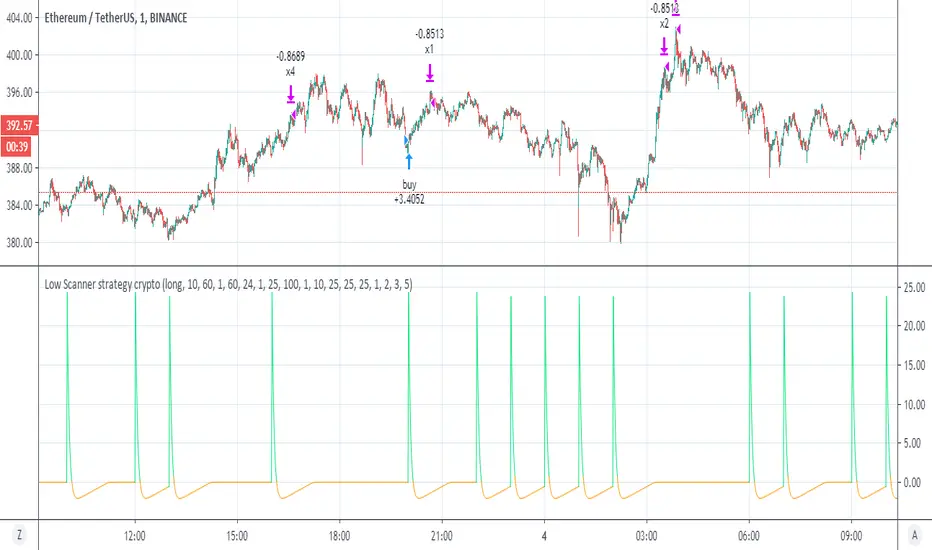
Low Scanner strategy cryptoThis is the last script of the Low scanner series
I have shown in script 1 the best strategy for stocks on 1 hour
script for forex 1 hour (if you look on comments you will find settings which are perfect for low TF (1 min system )
This strategy is the perfect weapen for crypto
no repaint as I shown the scanner do not use security
this system will buy and sell about every 1000 min in the end you will getyour profit which is progressive
set to 1,2,3, and 5 % where each time you take 25% of equaty out
as I shown before the power of the progresive take and my scanner make it best
the scnner serach for low point using my special RSI system with no repaint MTF
every time we get our profit out
the scanner will find us new low to start cycle again
so invite me for coffe if you like this system
thanks to TV that allow donation:)
so this is example of smart strategy that beat the odds
try on major crypto assets (it nice system )
without the script of adolgov
this system was not possible so I would like to thank him very much that he share with us his great script
The MATRIX: Ultimate Crypto Position StrategyHi all,
We are cryptocurrency miners and 'hodlers’ since 2013, with unwavering confidence in the technology behind it. We’d always thought that it would be a life-changing êvent. And we were right. We went from “broke” to making shit loads of money and all the way back to bitter nothing. If you are lucky, you probably haven’t experienced what if feels to be high on cash and then fall very deep low, but let me reassure you, it is a nasty feeling.
Then we wondered, what the hell did we do wrong? Or better say, what didn’t we do right! The answer was dead simple: We had no experience in trading, we were overwhelmed by emotions and we didn't use any trading strategy. Hence, we were doomed to fail from the beginning.
In order to build an all-in-one profitable trading strategy, we had to start from zero. The one thing we learned is that your goal for financial gain cannot be achieved without discipline and consistency. Our prime focus was to absorb as much info as possible regarding trading and coding by doing an extensive self-study, which consequentially took us to the next level.
One of the secrets to being successful from a trading perspective is to have an indefatigable and undying thirst for information and knowledge. As Bruce Lee once said: “Learning is never cumulative; it is a movement of knowing which has no beginning nor end”. So, we adapted what was useful, rejected what was useless, and added our own preferences based on our mindset. We were totally committed to be the best. Our goal was never to lose money again! Of course, this is an illusion, as no single strategy is correct all of the time.
Therefore, the final trading strategy was based on the following key elements:
• The avoidance of risk is more important than absolute profit. Do not anticipate and do not move without market confirmation. Being a little late in your trade is your indication if you are right or wrong.
• Offering simplicity and practicality, for those that do not have the time to trade 24/7.
• Believe in analysis and not in forecasting. Trading is a skill for those who are smart and gambling for those who are not.
In conclusion, we are absolutely thrilled to finally release this trading strategy after one year of extensive back testing and optimization. The script was supposed to be for personal use only, but because Tradingview has helped us a lot in this process, we want to share it with all of you and give something back to this amazing community. If you learned something new today and found value, please give us a like to show your support! We’d really appreciate it.
***The script is invite-only, message us to get script access***
-------------------------------------------------------------------------------------------------
The MATRIX: Ultimate Crypto Position Strategy should be used as follows:
• The trading strategy was designed and optimized for trading cryptocurrencies only ; furthermore it works best on established high market cap cryptocurrencies that have a clear trend such as:
BTCUSD
ETHUSD
LTCUSD
XRMUSD
EOSUSD
ADAUSD
DASHUSD
ETCUSD
• The trading strategy is based on swing/position methodology. The script must therefore be used on daily timeframe candles only (1D) .
• Use USD trading pairs only (e.g. use ETHUSD instead of the ETHBTC) since the individual trend is captured more effectively and therefore gives better results.
-------------------------------------------------------------------------------------------------
The MATRIX:Ultimate Crypto Position Strategy is based on the following indicators:
• Ichimoku Cloud ; acts as the leading indicator.
• Volume ; without strong volume , a market move is not valid.
• MACD and Vortex ; both being used as confirmation indicators.
• Choppiness index ; avoids trading in choppy markets.
• Bullish/ Bearish Regular Divergences in combination with RSI to spot tops and bottoms.
• Simple and Exponential Moving Averages ; prêvents trading against the trend.
The trading strategy is easy to use, trend based and without repainting, meaning once a signal has been made it is permanent and that no future data is used in the decision making. It detects the trend and filters out market noise based on more than 10 technical indicators. ONLY when all indicators align with each other the algorithm prints a BUY or SELL signal. The trading strategy provides high probability trading signals and minimizes risk! This script aims to capture the profit from longer term trending moves and by doing so filters out non-substantial trends and avoids the associated risks with these trades.
-------------------------------------------------------------------------------------------------
The MATRIX: Ultimate Crypto Position Strategy has the following features:
• Automatically generated Buy / Sell alerts in the form of a label.
• NO Repaint once candle is closed.
• SAFEGUARD ; custom built-in security prevẹnts trading when the price is out of equilibrium.
• Customizable Display for the Ichimoku cloud indicator display.
-------------------------------------------------------------------------------------------------
Below are the backtest results. Keep in mind that this strategy is quite conservative resulting in few long positions. These results are therefore no guarantee for the future.
Back test results: (only Long trades, signal to signal, order size: 100% of equity, commision fee 0.1%, period: start of chart)
Exchange-----Asset---------Timeframe---Percent Profitable----Profit Factor-----Total Trades----Max Drawdown---Average bars in trade-----Net Profit
Coinbase-----BTC/USD---------1D----------------100----------------N/A------------------10---------------0.00---------------------54-------------------6183.6
Coinbase-----ETH/USD---------1D----------------100----------------N/A------------------7----------------0.00---------------------46-------------------11673.0
Coinbase-----LTC/USD---------1D-----------------100---------------N/A-------------------7----------------0.00---------------------46------------------4727.0
Bínance------EOS/USD---------1D-----------------100---------------N/A-------------------3----------------0.00---------------------34------------------42.8
Bínance------ADA/USD---------1D-----------------100---------------N/A-------------------2----------------0.00---------------------40------------------118.4
Coinbase-----XTZ/USD---------1D-----------------100---------------N/A-------------------1----------------0.00---------------------36------------------34.4
Bínance------BNB/USD---------1D-----------------66.7--------------10.8-------------------6---------------24.22--------------------38------------------1488.8
Bínance------ETC/USD---------1D-----------------100---------------N/A-------------------2----------------0.00---------------------33------------------94.9
Bínance------XMR/USD---------1D-----------------100---------------N/A-------------------3----------------0.00---------------------43------------------74.2
Bínance------ICX/USD----------1D-----------------100---------------N/A-------------------2----------------0.00---------------------29------------------215.3
-------------------------------------------------------------------------------------------------
Reminder: Use this trading strategy at your own risk and trade responsibly. We are not responsible for any financial loss using this strategy.
***The script is invite-only, message us to get script access***

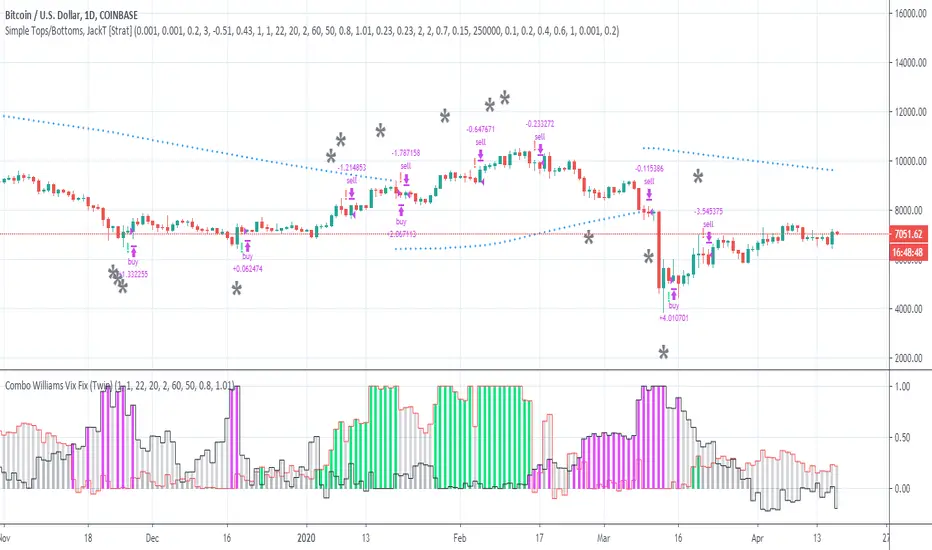
Simple Tops/Bottoms, [JackT]A percentage (pyramid) script for BTC/USD, Daily.
Breakdown
The script is following one simple rule:
- Percentage orders based on volume
This is a pyramid setup based on volume but I am handling each order manually which makes it a custom pyramid strategy.
Instead of doing 100% portfolio sell/buy orders this script focuses on the momentum of volume and calculates a percentage of the portfolio that should be traded.
The percentage rises with the level of continuous orders with the same type. This means that if a second sell order is emitted before any buy order the percentage to sell is gradually increased to be higher than the previous sell order. And vise verca with buy orders.
The calculation is exponential rising but it also makes sure that the trade rarely reaches 100%. This enables the script to stay in the market on almost all opportunties given by the indicators.
How to use
The script is created from 3 indicators including Lucid SAR which helps to indicate the major trend.
It is possible to change the settings of the script in order to change the outcome. The settings is fitted to work with BTC/USD and the same settings works somewhat okay with ETH/USD aswell. Though I would recommend to fit the settings to work better with other pairs.
As mentioned, the script focuses on volume , which mean that it works better with major coins.
Enjoy the script and please let me know your thoughts!
//JackT
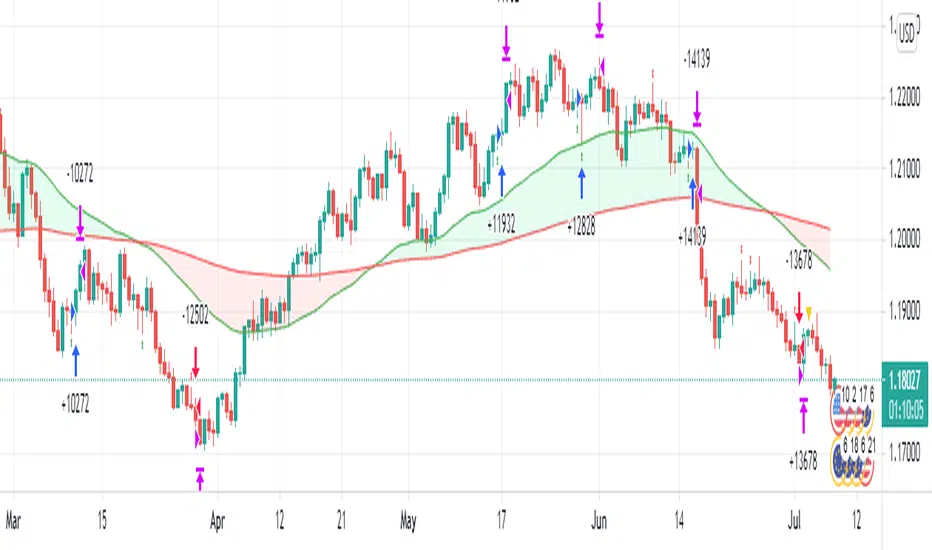
XPloRR S&P500 Stock Market Crash Detection Strategy v2XPloRR S&P500 Stock Market Crash Detection Strategy v2
Long-Term Trailing-Stop strategy detecting S&P500 Stock Market Crashes/Corrections and showing Volatility as warning signal for upcoming crashes
Detecting or avoiding stock market crashes seems to be the 'Holy Grail' of strategies.
Since none of the strategies that I tested can beat the long term Buy&Hold strategy, the purpose was to detect a stock market crash on the S&P500 and step out in time to minimize losses and beat the Buy&Hold strategy. So beat the Buy&Hold strategy with around 10 trades. 100% capitalize sold trade into new trade.
With the default parameters the strategy generates 10262% profit (starting at 01/01/1962 until release date), with 10 closed trades, 100% profitable, while the Buy&Hold strategy only generates 3633% profit, so this strategy beats the Buy&Hold strategy by 2.82 times !
Also the strategy detects all major S&P500 stock market crashes and corrections since 1962 depending on the Trailing Stop Smoothness parameter, and steps out in time to cut losses and steps in again after the bottom has been reached. The 5 major crashes/corrections of 1987, 1990, 2001, 2008 and 2010 were successfully detected with the default parameters.
The script was first released on November 03 2019 and detected the Corona Crash on March 04 2020 with a Volatility crash-alert and a Sell crash-alert.
I have also created an Alerter Study Script based on the engine of this script, which generates Buy, Sell and Volatility signals.
If you are interested in this Alerter version script, please drop me a mail.
The script shows a lot of graphical information:
the Close value is shown in light-green. When the Close value is temporarily lower than the Buy value, the Close value is shown in light-red. This way it is possible to evaluate the virtual losses during the current trade.
the Trailing Stop value is shown in dark-green. When the Sell value is lower than the Buy value, the last color of the trade will be red (best viewed when zoomed)
the EMA and SMA values for both Buy and Sell signals are shown as colored graphs
the Buy signals are labeled in blue and the Sell signals are labeled in purple
the Volatility is shown below in green and red. The Alert Threshold (red) is default set to 2 (see Volatility Threshold parameter below)
How to use this Strategy?
Select the SPX (S&P500) graph and add this script to the graph.
Look in the strategy tester overview to optimize the values Percent Profitable and Net Profit (using the strategy settings icon, you can increase/decrease the parameters), then keep using these parameters for future Buy/Sell signals on the S&P500.
More trades don't necessarily generate more overall profit. It is important to detect only the major crashes and avoid closing trades on the smaller corrections. Bearing the smaller corrections generates a higher profit.
Watch out for the Volatility Alerts generated at the bottom (red). The Threshold can by changed by the Volatility Threshold parameter (default=2% ATR). In almost all crashes/corrections there is an alert ahead of the crash.
Although the signal doesn't predict the exact timing of the crash/correction, it is a clear warning signal that bearish times are ahead!
The correction in December 2018 was not a major crash but there was already a red Volatility warning alert. If the Volatility Alert repeats the next weeks/months, chances are higher that a bigger crash or correction is near. As can be seen in the graphic, the deeper the crash is, the higher and wider the red Volatility signal goes. So keep an eye on the red flag!
Here are the parameters:
Fast MA Buy: buy trigger when Fast MA Buy crosses over the Slow MA Buy value (use values between 10-20)
Slow MA Buy: buy trigger when Fast MA Buy crosses over the Slow MA Buy value (use values between 21-50)
Minimum Buy Strength: minimum upward trend value of the Fast MA Buy value (directional coefficient)(use values between 10-100)
Fast MA Sell: sell trigger when Fast MA Sell crosses under the Slow MA Sell value (use values between 10-20)
Slow MA Sell: sell trigger when Fast MA Sell crosses under the Slow MA Sell value (use values between 21-50)
Minimum Sell Strength: minimum downward trend value of the Fast MA Sell value (directional coefficient)(use values between 10-100)
Trailing Stop ATR: trailing stop % distance from the smoothed Close value (use values between 2-20)
Trailing Stop Smoothness: MA value for smoothing out the Trailing Stop close value
Buy On Start Date: force Buy on start date even without Buy signal (default: true)
Sell On End Date: force Sell on end date even without Sell signal (default: true)
Volatility EMA Period: MA value of the Volatility value (default 15)
Volatility Threshold: Threshold value to change volatility graph to red (default 2)
Volatility Graph Scaler: Scaling of the volatility graph (default 5)
Important : optimizing and using these parameters is no guarantee for future winning trades!

SMA Cross Entry & Exit StrategyThis is a TradingView Strategy Script meaning you can't execute real trades using your exchange API connected to your TradingView account, it is designed for backtesting only
This is a basic backtesting script for charting the bullish and bearish cross of two user defined simple moving averages, select the cog next to the name of the script ON the price chart in the left hand corner. The script will print to the screen either "Long Entry" or "Short Entry" depending on the direction of the cross. The script using TradingView strategies will subsequently close the opposite of the position that is executed when the bullish or bearish cross occurs. Simply put, if you are short and a bullish cross occurs, your short trade will close and be logged in strategies and the long will fire. You can pyramid the long and short positions to continue entering as long as the trend doesn't flip. You will find this in the script settings. Since this script is for backtesting you can manually set the "backtesting range" for TradingView Strategies and firing the "Long Entry" and "Short Entry". This as well, is in the settings.
Notice: When the SMA cross occurs, you have to wait till the next candle before TradingView Strategy will print the "Long Entry" or "Short Entry" to the screen
TradingView - How To Use Strategies: www.tradingview.com

Strategy VS Buy & HoldSUMMARY:
A strategy wrapper that makes a detailed and visual comparison between a given strategy and the buy & hold returns of the traded security.
DESCRIPTION:
TradingView has a "Buy & Hold Return" metric in the strategy tester that is often enough to assess how our strategy compares to a simple buy hold. However, one may want more information on how and when your strategy beats or is beaten by a simple buy & hold strategy. This script aims to show such detail by providing a more comprehensive metrics and charting the profit/loss of the given strategy against buy & hold.
As seen in the script, it plots/draws 4 elements:
1) Strategy P/L: strategy net profit + strategy open profit
2) Buy & Hold P/L: unrealized return
3) Difference: Strategy P/L - Buy & Hold P/L
4) Strategy vs Buy Hold Stats
> Percent of bars strategy P/L is above Buy & Hold
> Percent of bars strategy P/L is below Buy & Hold
> All Time Average Difference
ADJUSTABLE PARAMETERS:
All labels/panels can be disabled by unchecking these two options:
>bnh_info_panel = input(true, title='Enable Info Panel')
>bnh_indicator_panel = input(true, title='Enable Indicator Panel')
Comparison Date Range can be changed to better isolate specific areas:
>From Year, From Month, From Day
default: 1970 01 01
>To Year, To Month, To Day
default: 2050 12 31
Default settings basically covers all historical data.
HOW TO USE:
The default script contains a simple 50-200 SMA cross strategy, just delete and replace it. Those are everything between these lines:
/////////////////////////////////////////////////////////////////////////////////////
//////////////////////////////STRATEGY SCRIPT START//////////////////////////////////
(STRATEGY SCRIPT GOES HERE)
//////////////////////////////STRATEGY SCRIPT END////////////////////////////////////
/////////////////////////////////////////////////////////////////////////////////////
Removing all plots and drawings from your strategy is advisable.
If you are going to use the Comparison Date Range, apply "bnh_timeCond" to your strategy to align the dates. A sample on how it’s applied can be seen on the Placeholder MA cross strategy.
Note: bnh_timeCond returns a boolean series

TradingView Alerts to MT4 MT5 + dynamic variables NON-REPAINTINGAccidentally, I’m sharing open-source profitable Forex strategy. Accidentally, because this was aimed to be purely educational material. A few days ago TradingView released a very powerful feature of dynamic values from PineScript now being allowed to be passed in Alerts. And thanks to TradingConnector, they could be instantly executed in MT4 or MT5 platform of any broker in the world. So yeah - TradingConnector works with indices and commodities, too.
The logic of this EURUSD 6h strategy is very simple - it is based on Stochastic crossovers with stop-loss set under most recent pivot point. Setting stop-loss with surgical precision is possible exactly thanks to allowance of dynamic values in alerts. TradingConnector has been also upgraded to take advantage of these dynamic values and it now enables executing trades with pre-calculated stop-loss, take-profit, as well as stop and limit orders.
Another fresh feature of TradingConnector, is closing positions only partly - provided that the broker allows it, of course. A position needs to have trade_id specified at entry, referred to in further alerts with partial closing. Detailed spec of alerts syntax and functionalities can be found at TradingConnector website. How to include dynamic variables in alert messages can be seen at the very end of the script in alertcondition() calls.
The strategy also takes commission into consideration.
Slippage is intentionally left at 0. Due to shorter than 1 second delivery time of TradingConnector, slippage is practically non-existing. This can be achieved especially if you’re using VPS server, hosted in the same datacenter as your brokers’ servers. I am using such setup, it is doable. Small slippage and spread is already included in commission value.
This strategy is NON-REPAINTING and uses NO TRAILING-STOP or any other feature known to be faulty in TradingView backtester. Does it make this strategy bulletproof and 100% success-guaranteed? Hell no! Remember the no.1 rule of backtesting - no matter how profitable and good looking a script is, it only tells about the past. There is zero guarantee the same strategy will get similar results in the future.
To turn this script into study so that alerts can be produced, do 2 things:
1. comment “strategy” line at the beginning and uncomment “study” line
2. comment lines 54-59 and uncomment lines 62-65.
Then add script to the chart and configure alerts.
This script was build for educational purposes only.
Certainly this is not financial advice. Anybody using this script or any of its parts in any way, must be aware of high risks connected with trading.
Thanks @LucF and @a.tesla2018 for helping me with code fixes :)

Backtesting on Non-Standard Charts: Caution! - PineCoders FAQMuch confusion exists in the TradingView community about backtesting on non-standard charts. This script tries to shed some light on the subject in the hope that traders make better use of those chart types.
Non-standard charts are:
Heikin Ashi (HA)
Renko
Kagi
Point & Figure
Range
These chart types are called non-standard because they all transform market prices into synthetic views of price action. Some focus on price movement and disregard time. Others like HA use the same division of bars into fixed time intervals but calculate artificial open, high, low and close (OHLC) values.
Non-standard chart types can provide traders with alternative ways of interpreting price action, but they are not designed to test strategies or run automated traded systems where results depend on the ability to enter and exit trades at precise price levels at specific times, whether orders are issued manually or algorithmically. Ironically, the same characteristics that make non-standard chart types interesting from an analytical point of view also make them ill-suited to trade execution. Why? Because of the dislocation that a synthetic view of price action creates between its non-standard chart prices and real market prices at any given point in time. Switching from a non-standard chart price point into the market always entails a translation of time/price dimensions that results in uncertainty—and uncertainty concerning the level or the time at which orders are executed is detrimental to all strategies.
The delta between the chart’s price when an order is issued (which is assumed to be the expected price) and the price at which that order is filled is called slippage . When working from normal chart types, slippage can be caused by one or more of the following conditions:
• Time delay between order submission and execution. During this delay the market may move normally or be subject to large orders from other traders that will cause large moves of the bid/ask levels.
• Lack of bids for a market sell or lack of asks for a market buy at the current price level.
• Spread taken by middlemen in the order execution process.
• Any other event that changes the expected fill price.
When a market order is submitted, matching engines attempt to fill at the best possible price at the exchange. TradingView strategies usually fill market orders at the opening price of the next candle. A non-standard chart type can produce misleading results because the open of the next candle may or may not correspond to the real market price at that time. This creates artificial and often beneficial slippage that would not exist on standard charts.
Consider an HA chart. The open for each candle is the average of the previous HA bar’s open and close prices. The open of the HA candle is a synthetic value, but the real market open at the time the new HA candle begins on the chart is the unrelated, regular open at the chart interval. The HA open will often be lower on long entries and higher on short entries, resulting in unrealistically advantageous fills.
Another example is a Renko chart. A Renko chart is a type of chart that only measures price movement. The purpose of a Renko chart is to cluster price action into regular intervals, which consequently removes the time element. Because Trading View does not provide tick data as a price source, it relies on chart interval close values to construct Renko bricks. As a consequence, a new brick is constructed only when the interval close penetrates one or more brick thresholds. When a new brick starts on the chart, it is because the previous interval’s close was above or below the next brick threshold. The open price of the next brick will likely not represent the current price at the time this new brick begins, so correctly simulating an order is impossible.
Some traders have argued with us that backtesting and trading off HA charts and other non-standard charts is useful, and so we have written this script to show traders what happens when order fills from backtesting on non-standard charts are compared to real-world fills at market prices.
Let’s review how TV backtesting works. TV backtesting uses a broker emulator to execute orders. When an order is executed by the broker emulator on historical bars, the price used for the fill is either the close of the order’s submission bar or, more often, the open of the next. The broker emulator only has access to the chart’s prices, and so it uses those prices to fill orders. When backtesting is run on a non-standard chart type, orders are filled at non-standard prices, and so backtesting results are non-standard—i.e., as unrealistic as the prices appearing on non-standard charts. This is not a bug; where else is the broker emulator going to fetch prices than from the chart?
This script is a strategy that you can run on either standard or non-standard chart types. It is meant to help traders understand the differences between backtests run on both types of charts. For every backtest, a label at the end of the chart shows two global net profit results for the strategy:
• The net profits (in currency) calculated by TV backtesting with orders filled at the chart’s prices.
• The net profits (in currency) calculated from the same orders, but filled at market prices (fetched through security() calls from the underlying real market prices) instead of the chart’s prices.
If you run the script on a non-standard chart, the top result in the label will be the result you would normally get from the TV backtesting results window. The bottom result will show you a more realistic result because it is calculated from real market fills.
If you run the script on a normal chart type (bars, candles, hollow candles, line, area or baseline) you will see the same result for both net profit numbers since both are run on the same real market prices. You will sometimes see slight discrepancies due to occasional differences between chart prices and the corresponding information fetched through security() calls.
Features
• Results shown in the Data Window (third icon from the top right of your chart) are:
— Cumulative results
— For each order execution bar on the chart, the chart and market previous and current fills, and the trade results calculated from both chart and market fills.
• You can choose between 2 different strategies, both elementary.
• You can use HA prices for the calculations determining entry/exit conditions. You can use this to see how a strategy calculated from HA values can run on a normal chart. You will notice that such strategies will not produce the same results as the real market results generated from HA charts. This is due to the different environment backtesting is running on where for example, position sizes for entries on the same bar will be calculated differently because HA and standard chart close prices differ.
• You can choose repainting/non-repainting signals.
• You can show MAs, entry/exit markers and market fill levels.
• You can show candles built from the underlying market prices.
• You can color the background for occurrences where an order is filled at a different real market price than the chart’s price.
Notes
• On some non-standard chart types you will not obtain any results. This is sometimes due to how certain types of non-standard types work, and sometimes because the script will not emit orders if no underlying market information is detected.
• The script illustrates how those who want to use HA values to calculate conditions can do so from a standard chart. They will then be getting orders emitted on HA conditions but filled at more realistic prices because their strategy can run on a standard chart.
• On some non-standard chart types you will see market results surpass chart results. While this may seem interesting, our way of looking at it is that it points to how unreliable non-standard chart backtesting is, and why it should be avoided.
• In order not to extend an already long description, we do not discuss the particulars of executing orders on the realtime bar when using non-standard charts. Unless you understand the minute details of what’s going on in the realtime bar on a particular non-standard chart type, we recommend staying away from this.
• Some traders ask us: Why does TradingView allow backtesting on non-standard chart types if it produces unrealistic results? That’s somewhat like asking a hammer manufacturer why it makes hammers if hammers can hurt you. We believe it’s a trader’s responsibility to understand the tools he is using.
Takeaways
• Non-standard charts are not bad per se, but they can be badly used.
• TV backtesting on non-standard charts is not broken and doesn’t require fixing. Traders asking for a fix are in dire need of learning more about trading. We recommend they stop trading until they understand why.
• Stay away from—even better, report—any vendor presenting you with strategies running on non-standard charts and implying they are showing reliable results.
• If you don’t understand everything we discussed, don’t use non-standard charts at all.
• Study carefully how non-standard charts are built and the inevitable compromises used in calculating them so you can understand their limitations.
Thanks to @allanster and @mortdiggiddy for their help in editing this description.
Look first. Then leap.

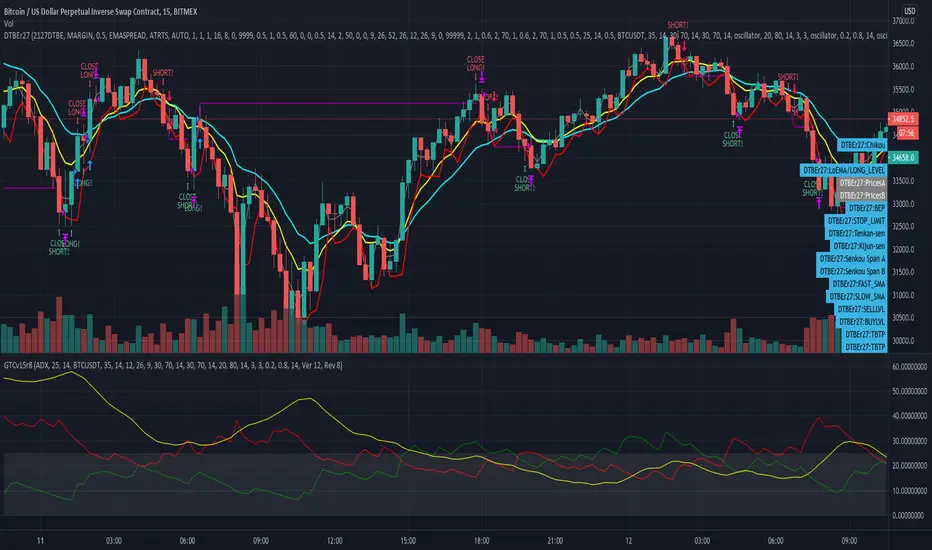
Gunbot Deluxe Tuners BERevision 18
Gunbot Deluxe Tuners BE (Black Edition) is the official Gunthy version of Gunbot Deluxe Tuners.
It is an all in one script simulation of Gunbot with the ability to optimize Gunbot settings through backtesting any combination of the script's included buy / sell strategies along with extra conditions and trailing options.
The companion script allows user to automatically send alerts directly to Gunbot through the Gunbot TradingView add-on.
Available only to verified Gunbot owners. No exceptions. Anyone interested in obtaining this script must contact either their official Gunbot reseller or me privately.
No public requests or donations for access to this script will be granted. No exceptions.
NOTICE: By requesting access to this script you acknowledge that you have read and understood that this is for research purposes only and neither I or Gunthy are responsible for any financial losses you may incur by using this script!
CMYK RMI SMA Automated Strategy▼ This is the strategy version of the script, For Backtesting
◊ Introduction
This script makes use of three RMI's and SMA's, that indicate Overbought/Oversold on different Periods that correspond with Frequency’s that move the market.
◊ Origin
This is an update on █▓▒░ CMYK ♦ RMI ♦ TRIPLE ░▒▓█
◊ Usage
This script is intended for Automated Trading on the 1-5 minute chart.
◊ Features Summary
Two Part Indicator
Strategy Type Selection
Three RMI's SMA's
Trend adjustment
Pump/Dump Entry Delay
Pyramiding
Ignore first entries
Take Profit
Stop Loss
Interval between Entries
Multiring Fix
Alert signal Seperation
◊ Community
Wanna try this script out ? need help resolving a problem ?
CMYK :: discord.gg
AUTOVIEW :: discordapp.com
TRADINGVIEW UNOFFICIAL :: discord.gg
◊ Setting up Autoview Alerts
Use the study version of this script, To set up The Alerts Autoview Picks up on.
Goto the CMYK Discord for support and Settings.
◊ Backtesting
Use the strategy version of this script for backtesting.
◊ Contact
Wanna try this script out ? need help resolving a problem ?
CMYK :: discord.gg

Backtest any Indicator [Target Mode] StrategyUniversal Backtester Strategy with Sequential Logic
This strategy serves as a highly versatile, universal backtesting engine designed to test virtually any indicator-based trading system without requiring custom code for every new idea. It transforms standard indicator comparisons into a robust trading strategy with advanced features like sequential entry steps, dynamic target modes, and automated webhook alerts.
The core philosophy of this script is flexibility. Whether you are testing simple crossovers (e.g., MA Cross) or complex multi-stage setups (e.g., RSI overbought followed by a MACD flip), this tool allows you to configure logic via the settings panel and immediately see backtested results with professional-grade risk management.
Core Logic: Source vs. Target Mode
The fundamental building block of this strategy is the "Comparator" engine. Instead of hard-coding specific indicators, the script allows users to define logic slots (L1-L5 for Longs, S1-S5 for Shorts).
Each slot operates on a flexible comparison logic:
Source: The primary indicator you are testing (e.g., Close Price, RSI, Volume).
Operator: The condition to check (Equal/Cross, Greater Than, Less Than).
Target Mode:
Value Mode: Compares the Source against a fixed number (e.g., RSI > 70).
Source Mode: Compares the Source against another dynamic indicator (e.g., Close > SMA 200).
This "Target Mode" switch allows the strategy to adapt to almost any technical analysis concept, from oscillator levels to moving average trends.
Advanced Entry System: Sequential Steps (1-5)
Unlike standard backtesters that usually require all conditions to happen simultaneously (AND logic), this strategy implements a State Machine for sequential execution. Each of the 5 entry slots (L1-L5 / S1-S5) is assigned a "Step" number.
The logic flows as follows:
Stage 1: The strategy waits for all conditions assigned to "Step 1" to be true.
Latch & Wait: Once Step 1 is met, the strategy "remembers" this and advances to Stage 2. It waits for a subsequent bar to satisfy Step 2 conditions.
Trigger: The actual trade entry is only executed once the highest assigned step is completed.
Example Use Case:
Step 1: Price closes below the Lower Bollinger Band (Dip).
Step 2: RSI crosses back above 30 (Confirmation).
Execution: Buy Signal triggers on the Step 2 confirmation candle.
This creates a realistic "Setup -> Trigger" workflow common in professional trading, preventing premature entries.
Exit Logic & Risk Management
The strategy employs a dual-layer exit system to maximize profit retention and protect capital.
1. Signal-Based Exits (OR Logic) There are 5 configurable exit slots (LX1-LX5 / SX1-SX5). Unlike entries, these operate on "OR" logic. If any enabled exit condition is met (e.g., RSI becomes overbought OR Price crosses below EMA), the position is closed immediately.
2. Hard Stop & Take Profit
Fixed %: Users can set a hard percentage-based Stop Loss and Take Profit.
Trailing Stop: A toggleable "Trailing?" feature allows the Stop Loss to dynamically trail the price.
Longs: The SL moves up as the price makes new highs.
Shorts: The SL moves down as the price makes new lows.
Automated Alerts & Webhooks
This script is built with automation in mind. It includes a dedicated makeJson() function that constructs a JSON payload compatible with most trading bots (e.g., 3Commas, TradersPost, Tealstreet).
Alert Modes Supported: | Alert Type | Description | | :--- | :--- | | Order Fills Only | Triggers standard TradingView strategy alerts when the broker emulator fills an order. | | Alert() Function | Triggers specific JSON payloads defined in the code ("action": "buy", "ticker": "MNQ", etc.). |
The script automatically calculates the alert quantity based on your equity percentage settings, ensuring the payload matches your backtest sizing.
Dashboard & Visuals
To aid in rapid analysis, the strategy includes visual tools directly on the chart:
Performance Table: A dashboard (top-right) displays real-time stats including Net Profit, Win Rate, Profit Factor, and Max Drawdown.
Trade Markers: Custom labels (goLong, exLong) show exactly where trades opened and closed, including the trade number and profit percentage.
SL/TP Visualization: Dynamic step-lines (Orange for SL, Lime for TP) show exactly where your protection levels are sitting, helping you visually verify if your stops are too tight or too loose.

Advanced Breakout System v2.0Advanced Breakout System v2.0
Developed by: Mohammed Bedaiwi
This script hunts for high-probability breakouts by combining price consolidation zones, volume spikes vs. average volume, smart money flow (OBV), and a Momentum Override for explosive moves that skip consolidation. Additionally, it automatically identifies and plots Support and Resistance levels with price labels to help you visualize market structure.
The system follows a "Watch & Confirm" logic: it first prints a WATCH setup, then a BUY only if price confirms strength.
💡 JUSTIFICATION OF CONCEPTS (MASHUP & ORIGINALITY)
This script is an original mashup combining several analytical concepts to address common breakout failures:
Volatility Compression Engine: Uses built-in functions like ta.highest() and ta.lowest() to mathematically define the setup phase where price volatility is compressed below a user-defined threshold.
Volume Spike Confirmation: The breakout must be confirmed by a volume increase greater than a moving average of volume, signaling strong market interest.
Smart Volume Filter (OBV): This is the key component. By checking if ta.obv is above its own Moving Average, we confirm that accumulation has been occurring during the consolidation period, suggesting institutional positioning before the price break.
Multi-Exit Risk System: Employs dynamic exits (EMA cross, volume dump, bearish pattern) instead of static stop-losses to manage risk adaptively based on real-time market action.
Market Structure Visualization: The script also includes a Support & Resistance engine to plot key swing pivots and price labels for visual context.
✅ STRATEGY RESULTS & POLICY COMPLIANCE
To ensure non-misleading and transparent backtesting results, this strategy is published with the following fully compliant properties:
Dataset Compliance: The backtest is performed on the CMTL Daily (1D) chart across a long history, generating 201 total trades. This significantly exceeds the minimum requirement of 100 trades, providing a robust test dataset.
Risk Control: The strategy uses a conservative order size set to 2% of equity (default_qty_value=2), strictly adhering to the sustainable risk recommendation of 5-10% of equity per trade.
Transaction Costs: Realistic trading conditions are modeled using 0.07% commission and 3 ticks slippage to prevent the overestimation of profitability.
⚙️ VISUAL GUIDE & SIGNAL LOGIC
Key Color Legend (Visual Guide):
WATCH – Setup (Yellow Arrow Down): Potential breakout setup detected.
BUY – Confirmation (Green Arrow Up): Confirmed breakout, triggered when price trades above the high of the WATCH candle.
SELL – Break (Orange Arrow): Short-term trend weakness, triggered when price closes below the Fast EMA (9).
SELL – Dump (Dark Red Arrow): Distribution / volume dump, triggered by a bearish candle with abnormally high volume.
SELL – Pattern (Purple Arrow): Bearish price-action pattern (such as a bearish engulfing).
Support & Resistance Lines (Red/Green): Small horizontal lines plotted at key swing points with exact price labels.
⌨️ INPUTS (DEFAULT SETTINGS)
Entry settings: Consolidation Lookback (default 20) = bars used to detect consolidation. Consolidation Range % (default 12%) = max allowed range size. Volume Spike Multiplier (default 1.2) = factor above average volume to count as a spike. Force Signal on Big Moves (default ON) = forces a WATCH signal on high-momentum moves.
Exit settings: Enable Fast Exit (EMA 9) toggles the SELL – Break signal. Dump Volume Multiplier defines what counts as “dump” volume.
Support & Resistance: Adjustable Pivot Left/Right bars control the sensitivity of the support and resistance lines.
⚠️ Disclaimer Trading involves significant risk of loss. This script is for educational and informational purposes only and is not financial advice or a recommendation to buy or sell any asset. BUY and SELL signals are rule-based and derived from historical behavior and do not guarantee future performance. Always use your own analysis and risk management. This is an open-source strategy; users are encouraged to test it across different symbols and timeframes.

12M Return Strategy This strategy is based on the original Dual Momentum concept presented by Gary Antonacci in his book “Dual Momentum Investing.”
It implements the absolute momentum portion of the framework using a 12-month rate of change, combined with a moving-average filter for trend confirmation.
The script automatically adapts the lookback period depending on chart timeframe, ensuring the return calculation always represents approximately one year, whether you are on daily, weekly, or monthly charts.
How the Strategy Works
1. 12-Month Return Calculation
The core signal is the 12-month price return, computed as:
(Current Price ÷ Price from ~1 year ago) − 1
This return:
Plots as a histogram
Turns green when positive
Turns red when negative
The lookback adjusts automatically:
1D chart → 252 bars
1W chart → 52 bars
1M chart → 12 bars
Other timeframes → estimated to approximate 1 calendar year
2. Trend Filter (Moving Average of Return)
To smooth volatility and avoid noise, the strategy applies a moving average to the 12M return:
Default length: 12 periods
Plotted as a white line on the indicator panel
This becomes the benchmark used for crossovers.
3. Trade Signals (Long / Short / Cash)
Trades are generated using a simple crossover mechanism:
Bullish Signal (Go Long)
When:
12M Return crosses ABOVE its MA
Action:
Close short (if any)
Enter long
Bearish Signal (Go Short or Go Flat)
When:
12M Return crosses BELOW its MA
Action:
If shorting is enabled → Enter short
If shorting is disabled → Exit position and go to cash
Shorting can be enabled or disabled with a single input switch.
4. Position Sizing
The strategy uses:
Percent of Equity position sizing
You can specify the percentage of your portfolio to allocate (default 100%).
No leverage is required, but the strategy supports it if your account settings allow.
5. Visual Signals
To improve clarity, the strategy marks signals directly on the indicator panel:
Green Up Arrows: return > MA
Red Down Arrows: return < MA
A status label shows the current mode:
LONG
SHORT
CASH
6. Backtest-Ready
This script is built as a full TradingView strategy, not just an indicator.
This means you can:
Run complete backtests
View performance metrics
Compare long-only vs long/short behavior
Adjust inputs to tune the system
It provides a clean, rule-driven interpretation of the classic absolute momentum approach.
Inspired By: Gary Antonacci – Dual Momentum Investing
This script reflects the absolute momentum side of Antonacci’s original research:
Uses 12-month momentum (the most statistically validated lookback)
Applies a trend-following overlay to control downside risk
Recreates the classic signal structure used in academic studies
It is a simplified, transparent version intended for practical use and educational clarity.
Disclaimer
This script is for educational and research purposes only.
Historical performance does not guarantee future results.
Always use proper risk management.

W/M Pattern Strategy + MACD/RSI Confirmation V3.0 by ThaungkmitlW/M Pattern Strategy + MACD/RSI Confirmation V3.0
Description Text:
This script is a comprehensive Strategy (backtestable) that combines classical Chart Patterns with momentum indicators to identify high-probability reversal setups. It focuses on detecting "W" Patterns (Double Bottoms/Higher Lows) and "M" Patterns (Double Tops/Lower Highs), filtered by MACD and RSI to reduce false signals.
How It Works
The strategy relies on a "Confluence" of three factors before triggering an entry:
1. Price Action Patterns (W & M)
W Pattern (Bullish): The script detects Pivot Lows. If a new Pivot Low is higher than the previous one (forming a Higher Low structure), it marks a potential "W" pattern.
M Pattern (Bearish): The script detects Pivot Highs. If a new Pivot High is lower than the previous one (forming a Lower High structure), it marks a potential "M" pattern.
2. MACD Confirmation (Zero Line)
Price action alone is not enough. The script waits for the MACD Line to cross the Zero Line:
Buy: MACD crosses UP over 0 (indicating bullish momentum shift).
Sell: MACD crosses DOWN under 0 (indicating bearish momentum shift).
3. RSI Threshold
To ensure the trend has strength, the RSI (Relative Strength Index) acts as a final filter:
Buy Condition: RSI must be above 50.
Sell Condition: RSI must be below 50.
Visual Features
Pivot Labels: Automatically marks Pivot High (Red Triangle) and Pivot Low (Green Triangle).
Pattern Lines: Draws lines connecting the swing points when a potential W or M pattern is detected.
Signals: Displays "BUY" or "SELL" labels with text explaining the setup (e.g., "W+MACD+RSI").
Background: Highlights the chart background (Green/Red) when a valid trade signal occurs.
EMAs: Plots EMA 10 (Blue) and EMA 15 (Red) to help you visualize the immediate trend direction.
Settings
Pivot Left/Right Bars: Adjust the sensitivity of the Swing detection.
MACD Settings: Fast, Slow, and Signal lengths (Standard 12, 26, 9).
RSI Settings: Adjust Length and the Threshold level (Default is 50).
Backtesting
This is a strategy script, meaning you can use the Strategy Tester panel below the chart to see how this logic performs on historical data for your chosen timeframe and asset.
Disclaimer: This tool is for educational purposes. Past performance in backtesting does not guarantee future results.

Volume Momentum Strategy [MA/VWAP Cross]Deconstructing the Volume Momentum Strategy: An Analysis of MA-VWAP Cross Mechanics
Introduction
The "Volume Momentum Strategy " is a technical trading algorithm programmed in Pine Script v6 for the TradingView platform. At its core, the strategy is a trend-following system that utilizes the interaction between a specific Moving Average (MA) and the Volume Weighted Average Price (VWAP) to generate trade signals. While the primary execution logic relies on price crossovers, the strategy incorporates a sophisticated secondary layer of analysis using the Commodity Channel Index (CCI) and Stochastic Oscillator. Uniquely, these secondary indicators are applied to volume data rather than price, serving as a gauge for market participation and momentum intensity.
The Core Engine: MA and VWAP Crossover
The primary engine driving the strategy's buy and sell decisions is the crossover relationship between a user-defined Moving Average and the VWAP.
1. The Anchor (VWAP): The strategy calculates the Volume Weighted Average Price based on the HLC3 (High, Low, Close divided by 3) source. VWAP serves as the dynamic benchmark for "fair value" throughout the trading session.
2. The Trigger (Moving Average): The script allows for flexibility in defining the "fast" line, offering options such as Simple (SMA), Exponential (EMA), or Hull Moving Averages.
3. The Signal:
o A Long (Buy) signal is generated when the chosen MA crosses over the VWAP. This suggests that short-term price momentum is exceeding the average volume-weighted price of the session, indicating bullish sentiment.
o A Short (Sell) signal is generated when the MA crosses under the VWAP, indicating bearish pressure where price is being pushed below the session's volume-weighted average.
The Role of CCI and Stochastic: Analyzing Volume Momentum
The prompt specifically inquires about how the CCI and Stochastic indicators fit into this process. In standard technical analysis, these oscillators are used to identify overbought or oversold price conditions. However, this strategy repurposes them to analyze Volume Momentum.
1. The Calculation
Instead of using close prices as the input source, the script passes volume data into both indicator functions:
• Volume CCI: Calculated as ta.cci(volume, cciLength). This measures the deviation of current volume from its statistical average.
• Volume Stochastic: Calculated as ta.stoch(volume, volume, volume, stochLength). This gauges the current volume relative to its recent range.
2. The "Volume Spike" Condition
The strategy combines these two indicators to define a specific market condition labeled isVolumeSpike. A volume spike is confirmed only when both conditions are met simultaneously:
• The Volume CCI must be greater than a defined threshold (default: 100).
• The Volume Stochastic must be greater than a defined threshold (default: 80).
3. Integration into the Process
It is critical to note how this script currently applies this "Volume Spike" logic:
• Visual Confirmation: In the current version of the code, the isVolumeSpike boolean is used strictly for visual feedback. When a spike is detected, the script paints the specific price bar yellow and plots a small triangle marker below the bar.
• Strategic Implication: While the code calculates these metrics, the variables long_condition and short_condition currently rely solely on the MA/VWAP crossover. The developer has left the volume logic as a visual overlay, noting in the comments that it serves as a "visual/alert" or a potential filter.
• Potential Alpha: Conceptually, this setup implies that a trader should look for the MA/VWAP crossover to occur coincidentally with—or shortly after—a "Volume Spike" (yellow bar). This would confirm that the price move is backed by significant institutional participation (volume) rather than just retail noise.
Risk Management and Time Constraints
The strategy wraps these technical signals in a robust risk management framework. It includes hard-coded time windows (start/stop trading times) and a "Close All" function to prevent holding positions overnight. Furthermore, it employs both percentage-based and dollar-based Stop Loss and Take Profit mechanisms, ensuring that every entry—whether generated by a high-momentum crossover or a standard trend move—has a predefined exit plan.
Conclusion
The "Volume Momentum Strategy" is a hybrid system. It executes trades based on the reliable trend signal of MA crossing VWAP but informs the trader with advanced volume analytics. By processing volume through the CCI and Stochastic calculations, it provides a "heads-up" display regarding the intensity of market participation, allowing the trader to distinguish between low-volume drifts and high-volume breakout moves.

Logic Flow Signals & Backtest [bercutiatia]To understand the advanced logic of the tool, it is essential that you carefully read each topic and check the visual examples in this presentation.
--
Who is the Logic Flow Signals & Backtest tool recommended for?
Ideal for traders looking to increase the reliability and level of their operations. Recommended for those who want to create rigorous confluences, validate strategies with backtesting, and transform emotional management into systematic and measurable processes.
How can the Logic Flow Signals & Backtest tool help me?
High-confidence signals! You combine TradingView indicators and create a single robust signal, eliminating the frustration of having to spend hours in front of the chart and still clicking at the wrong time. This ensures that your entry is validated by logic, not emotional impulse.
--
Logic Flow Signals & Backtest is a versatile and powerful tool designed to test and validate your trading ideas with indicators from the TradingView community.
Extreme flexibility: Allows you to combine indicators available on TradingView (EMAs, RSI, MACD, SMC, etc.) to create custom entry and exit logics.
Sequential Logic: Goes far beyond simple crossovers. You can define rules where signal A must occur before signal B — and, if desired, before signal C or D — to validate an entry. Add time, order, and context filters, creating truly intelligent sequential logic that generates a single final alert only when all conditions align.
With Stages (Stage 1, Stage 2, etc.), your entries follow the exact sequence you define. And the best part: you no longer need to spend hours in front of the chart waiting for confluences. Simply set up your stages once, create an alert in TradingView, and the system will automatically notify you when the ideal combination of signals occurs.
Sequence Invalidation: Offers the option to define conditions that, if they occur, immediately cancel an ongoing entry sequence, helping to avoid entries in unfavorable scenarios.
Explaining the first image example (chart below):
LONG INDICATOR 1 (Stage 1): The market confirms a change in character (CHoCH Bullish). The system enters an alert state awaiting the confluence of the next indicators.
LONG INDICATOR 2 and 3 (Stage 2): Entry is only released when the SMA17 crosses above the SMA72 (indicator 2), but with one condition: The SMA72 must be ABOVE the SMA305 (indicator 3); Without this alignment of indicator 3, the signal of indicator 2 does not occur.
LONG INDICATOR 4 (Invalidation Rule): If at any point in the sequence the SMA72 crosses below the SMA305, the setup is immediately canceled and no entry signal is generated. The sequence restarts with indicator 1.
EXIT LONG (Hybrid Exit TP + SIGNAL): The trade seeks a TP target of 1000 ticks, but has a technical "Trailing Stop": if the trend reverses (Exit Long Indicator 1 = SMA72 crosses below the SMA305) before the target, the position is closed to protect capital.
SHORT INDICATOR 1 (Stage 1): Identification of weakness in the market with a Bearish CHoCH.
SHORT INDICATOR 2 and 3 (Stage 2): Entry is only released when the SMA17 crosses below the SMA72 (indicator 2), but with a strict condition: The SMA72 must be BELOW the SMA305 (indicator 3); Without this STATE of indicator 3, the signal from indicator 2 does not occur.
SHORT INDICATOR 4 (Invalidation Rule): If at any point in the sequence the SMA72 crosses above the SMA305, the setup is immediately canceled and no entry signal is generated. The sequence starts again with indicator 1.
EXIT SHORT (Hybrid Exit TP + SIGNAL): The trade seeks a target of 1000 ticks, but has a technical "Trailing Stop": if the downtrend reverses (Exit Short Indicator 1 = SMA72 crosses above the SMA305) before the target, the position is closed to protect capital.
In this strategy, we use the external indicators: Multiple MTF MA and Smart Money Concepts (Advanced)
--
Stage Duration: In STAGE DURATION , you control the maximum time (in candles) allowed for each transition between stages to occur. If the time limit expires before the next stage is reached, the sequence is reset. Keep it at 0 to disable the time limit.
The "Stage Duration" function is available in four separate blocks on the settings panel:
- LONG - STAGE DURATION: Controls the time limit (in candles) between Long entry stages (for example from Stage 1 to Stage 2).
- LONG EXIT - STAGE DURATION: Controls the time limit between Long exit stages.
- SHORT - STAGE DURATION: Controls the time limit between Short entry stages.
- SHORT EXIT - STAGE DURATION: Controls the time limit between Short exit stages.
Explaining the second image example (chart below):
Stage 1 (INDICATOR 1): New Fair Value Gap (FVG) Bullish Confirmed.
- Meaning: The move starts with a bullish FVG (Fair Value Gap), indicating a confirmed imbalance where buyers were much more aggressive than sellers.
Stage 2 (INDICATOR 2): EMA10 crossing above the EMA50.
- Meaning: Immediately after the FVG trigger, the fast moving average (10 periods) crosses the intermediate moving average (50 periods). This confirms that the initial FVG impulse was not an isolated event but the beginning of a short-term trend.
Stage 3: In this final stage, we require two simultaneous confirmations to validate the entry:
- INDICATOR 3: The EMA10 crosses above the EMA100, indicating that the movement has enough strength to break through larger barriers.
- INDICATOR 4: The RSI must be above its own moving average (SMA14). This ensures the asset is gaining momentum at the exact moment the averages are broken, avoiding entries in "tired" markets.
Stage Duration: The most important feature of this setup is the restricted time window.
- Rule: From Stage 1 to 2, and from Stage 2 to 3, the maximum interval to accept confluences is only 3 candles.
- Why this is vital? If the market took 20 candles to align these conditions, it would indicate weakness or indecision. By demanding that everything happens within a maximum of 3 candles per step, the setup filters only the moves where buying pressure is urgent and aggressive, increasing the probability of an explosive move in favor of the trade.
Asymmetric Risk Management: To complement a high-probability and high-pressure setup, we use aggressive risk management:
- Stop Loss (Technical/Short): 200 Ticks. If the buying pressure fails quickly, we exit early with a small loss.
- Take Profit (Long Target): 1000 Ticks. We aim to ride the impulse "leg" that the setup identified.
- Risk/Reward: 5:1. This means a single winning trade covers five losing trades, making the strategy mathematically viable in the long term.
In this strategy, we use the external indicators: Multiple MTF MA , Smart Money Concepts (Advanced) and Relative Strength Index (RSI) .
--
Multiple Operating Modes
It is not limited to sequences. It can operate by confluence (where all signals must be valid at the same time), by single trigger (only one signal is required), or by "OR" logic (any one of the defined signals).
- If you use only Stage 1 in more than one indicator session, the entry will only occur if all enabled conditions are true simultaneously.
- Any condition defined as OR can trigger the entry by itself.
- If only one condition block is enabled, the single indicator will function as a simple signal.
Multiple and Simultaneous Exits
It allows for the configuration of exits by both indicators and TP/SL targets. The strategy will close the trade as soon as any of these conditions are met first (indicator signal, profit target, or loss limit
Integrated Risk Management
It includes Stop Loss and Take Profit exits by percentage and ticks, which are easy to configure and essential for risk management. The strategy calculates the exact TP and SL prices based on your entry price and monitors the market on every tick.
Explaining the Third Image Example (Chart Below)
The move was validated by a 4-step logical sequence (Stage 1) and managed by a hybrid exit system.
Short Indicator 1, 2, and 3: The price (Close) crossed below the SMA200, SMA72, and SMA17 averages simultaneously.
- What this means: When a single candle has the strength to break below the short-term (17), mid-term (72), and long-term (200) averages, it indicates a high probability for the price to seek lower levels.
To reinforce Indicators 1 through 3, we added an extra layer of confirmation.
Short Indicator 4: The Positive Volume Index (PVI) needed to be below its own long-term average (EMA300).
- Why this is important: PVI below the average confirms that selling volume is dominant, validating that the break of the averages was not just noise.
Triple Exit Management (Maximum Security)
The great advantage of this tool is the ability to manage risk dynamically. In this trade, we configured three simultaneous exit conditions, where the first one to be met closes the position:
1. Financial Target (TP): A fixed Take Profit of 15%.
2. Exit Short Indicator 1 (Technical Exit 1): If the average (SMA72) crosses above the average (SMA200), the trade is closed.
3. Exit Short Indicator 2 (Technical Exit 2): If the PVI crosses above the EMA300, indicating an entry of buying strength, the trade is closed.
"OR" Logic: The tool monitors these conditions in real-time. Whichever occurs first triggers the exit, ensuring you lock in profit (TP) or protect your capital at the first sign from the indicators.
In this strategy, we use the external indicators: Multiple MTF MA and Positive Volume Index .
--
Reversal Mode (Stop and Reverse)
The Reversal Mode (Stop and Reverse) allows a new signal in the opposite direction (e.g., a SELL signal) to automatically close an existing position (e.g., BUY) and open a new one (sell). This "stop and reverse" function can be enabled or disabled in the settings, giving you full control over whether the strategy should only exit (awaiting a new signal) or immediately reverse the position.
Explaining the Fourth Image Example (Chart Below)
In this example, we demonstrate a setup focused on capturing every market "flip," keeping the trader positioned 100% of the time ("Always-in"), a technique widely used in automation.
- Long Entry: Occurs immediately upon confirming a bullish change of character (New CHoCH Bullish).
- Short Entry: Occurs immediately upon confirming a bearish change of character (New CHoCH Bearish).
- Exit (The Differentiator): We are not using fixed TP or SL here. The exit is triggered by Automatic Reversal.
The Power of "Exit by Opposite Signal"
Notice the labels on the chart: "Close Short" followed immediately by a "Long." This happens because the Allow Reversal function is enabled in the tool's settings.
When the market generates a buy signal, the tool understands that the sell thesis has been invalidated. It simultaneously sends an order to close the Short position and open a new Long position.
When to use this exit rule?
- Capturing Long Trends / Directional Movements: Ideal for volatile assets where you want to ride the trend until the market structure effectively changes.
- Operational Simplification: Eliminates the need to guess profit targets and acts as a loss limiter when the price moves against your position. The market dictates when to enter and when to exit.
Hybrid Flexibility:
The strongest point of Logic Flow is that you don't have to choose just one method. Reversal can be used in two ways:
1. Individually (as in the image): Reversal is the only form of exit. You stay in the move until the opposite signal.
2. Combined (Hybrid): You can enable Reversal and configure a safety Stop Loss + technical Take Profit (Exit Long/Short Indicator).
- Example: If the price hits your TP/SL first, you exit. If the market turns before the TP, the Reversal takes you out of the trade and generates a new trend alert.
In this strategy, we use the external indicators: Smart Money Concepts .
--
Backtesting: Far beyond creating logic and generating signals, Logic Flow Signals stands out due to its Integrated Backtest.
Backtesting serves as a reality check for the trader. It takes the strategy out of the realm of "imagination" and puts it to the test against historical data.
Here are the 4 main practical uses:
1. Verifying Feasibility (Proof of Concept): The most obvious use is to answer: "Does this idea make money?". Many strategies look visually perfect on the chart, but when you run the backtest, you discover that brokerage fees or frequent "stops" consume all the profit.
2. Knowing the "Worst-Case Scenario" (Drawdown): Maximum Drawdown: It shows you what the largest accumulated drop the strategy has ever experienced was. By identifying a Drawdown that exceeds the desired risk tolerance, the backtest allows for parameter optimization in search of a more efficient balance between risk and return.
3. Fine-Tuning (Optimization): It allows you to make changes such as: Increasing the profit target, changing the stop, removing an indicator, changing the chart timeframe, among other actions. You can test various variations instantly to find the most efficient configuration.
4. Expectation Management and Discipline: Backtesting does not eliminate fear nor guarantee that the future will repeat the past, but it serves as a reference map.
The Real Role: Aligning expectation with reality.
In the image below, you can check out how a backtest result is generated:
To understand the backtest results shown above, check the chart and the detailed operational logic below:
This operational example seeks to identify altcoins that are demonstrating an explosive decorrelation relative to Bitcoin. The logic is: we want to buy only the assets that are outperforming the market leader, precisely at the moment when speculative money (Open Interest) heavily enters the market.
For the buy signal (Long) to be triggered, three conditions must be simultaneously true (Stage 1):
Long Indicator 1 (Altcoin Strength): The asset's RSI must be above the 70 level (Overbought), indicating extremely strong bullish momentum.
Long Indicator 2 (Bitcoin Weakness): Bitcoin's RSI must be below the 50 level. This confirms that the Altcoin's rally is genuine and independent.
Long Indicator 3 (Money Flow): The Open Interest (open contracts) must be above the Extreme level of the OI DELTA indicator. This validates that new money is aggressively entering the asset to sustain the rally.
Risk Management: In this example, we configured an aggressive target to capture the altcoin volatility:
- Take Profit: 100%
- Stop Loss: 20%
- Risk/Reward: 5:1
In this strategy, we use the external indicators: RSI Crypto Strength (Asset vs BTC) and Open Interest Delta .
--
Configuring an Indicator Block
Each block (BUY INDICATOR 1, BUY INDICATOR 2, ...) allows you to define a complete condition.
- Enable (Activate): Simply turns this indicator block on or off.
- Source A: The first value you want to analyze.
example: The Closing Price (Close), Opening Price (Open), or another TradingView indicator.
- Condition: How 'Source A' will be compared.
example: Crossover/Crossunder, Greater Than, Less Than, Cross Up.
- Comparison Type: The option that defines whether you will compare 'Source A' with a fixed number or with another indicator.
- Fixed Value: Used if you selected "Fixed Value".
example: For an RSI greater than 70 condition, Source A would be the RSI, the Condition would be Greater Than, and the Fixed Value would be 70.
- Source B: Used if you selected "Source B".
example: For a condition where the EMA10 crosses above the EMA200, Source A would be the EMA10, the Condition would be 'Cross Up', and Source B would be the EMA200.
--
Configurable Alert Signals
Configurable Alert Signals: The tool allows for the creation of fully customized alerts for different types of events, such as entries, signal-based exits, take profit, and stop loss. These alerts can be used for both strategy automation and manual, real-time notifications.
The message field is highly flexible: it accepts dynamic placeholders, JSON structure, UUID identifiers, or any custom text, allowing integration with other external tools and systems via webhook.
Configuring Your Messages:
- LONG/SHORT - ALERTS: Defines the message for new entries.
- LONG/SHORT INDICATOR EXIT - ALERTS: Defines the message for signal-based exits (e.g., moving average cross).
- REVERSAL - ALERTS: Defines the message for when a position is closed by an opposite signal (stop-and-reverse).
- LONG/SHORT TP/SL EXIT - ALERTS: Defines the message for exits triggered by take profit (TP) or stop loss (SL), via percentage or ticks.
A Single Alert to Control Everything
You don't need to create separate alerts for "Buy," "Sell," or "Exits." On a single screen, you can create strategies by defining entries, signal-based exits, profit targets, or stop limits.
Alert Times (Operating Window)
In the Alert Times section, you can define a specific time (and time zone) for the strategy to generate entry or exit signals.
--
To create your alert, simply follow these steps:
- Condition: Select the script name: "Logic Flow Signals & Backtest".
- Message: Insert only the placeholder: {{strategy.order.alert_message}}
Once this single alert is active, it will "listen" to all orders executed by the strategy.
This means you can have your Long-Term, Short-Term, Signal-Based Exits, and TP/SL strategies active simultaneously. When any of these events are plotted on the chart, the script will send the customized message (which you wrote in the fields) to your single alert.
--
Advanced period filters: Allow you to test the strategy in specific date ranges, over the last X days, or over the last X bars, facilitating performance analysis in different market environments.
--
Status Panel: Displays a clear summary of all active rules and settings directly on the chart, facilitating the visualization and confirmation of the running logic.
Additionally, it has a settings box where you can activate or deactivate the panel, choose its position (such as at the bottom or side), and adjust its size.
--
The Thumbnail strategy uses the following external indicators: Multiple MTF MA and Breakout Finder .
--
Final Considerations:
The Logic Flow Signals & Backtest tool is a versatile and powerful system, designed to test and apply trading ideas based on multiple indicators from TradingView.
Its differential is being a customization environment: the script does not have integrated graphical indicators, as the objective is precisely to allow the user to combine and integrate multiple existing indicators in the TradingView community to build unique entry and exit logics.
It offers flexibility and precision, but the true value emerges when the trader integrates the tool into a consistent trading plan, with efficient risk management (Stop Loss and Take Profit), leverage control, and a professional mindset.
Important: Risk of Repainting (Unstable Data): Avoid indicators that 'repaint' (those that change their values in past bars after the closing of new candles). The backtest will be invalidated, and the actual performance of the strategy will fail.
Legal Warning and Didactic Purpose:
It is fundamental to understand that all visual examples, charts, and texts contained in this description do not constitute financial advice, buy or sell recommendations, nor a promise of easy or guaranteed gains.
This is an advanced support tool, not an automatic profit system. Use the integrated backtesting to evaluate the historical behavior of strategies before real execution and understand how different market conditions impact your results. The sole purpose of this material is to demonstrate the logical and execution capacity of the script, serving as a didactic guide for you to test and validate your own ideas.
Conclusion and Risk Warning:
Success in financial markets comes not only from a set of charting indicators, but from the trader's understanding, practice, and discipline. Our objective is to provide a robust, customizable, and intuitive solution, created to enhance your technical analysis and broaden your strategic vision, without replacing critical thinking and conscious decision-making.
Finally, remember: past results do not guarantee future performance. The real differentiator lies in continuous learning, testing, and evolution.

Multi-Mode Grid StrategyGrid Strategy (SIMPLE)
█ Overview
This script is a system trading tool designed to generate cash flow from market volatility without relying on short-term directional predictions. It operates on the principle of Grid Trading , creating a mesh of buy and sell orders within a user-defined price range.
The strategy automates the process of "buying the dip" and "selling the bounce" repeatedly. It is most effective in sideways markets or during accumulation phases where the price oscillates within a specific channel.
█ TRADING MINDSET & SETUP GUIDE
To use this tool effectively, you must shift your perspective from "Sniper" (trying to hit the perfect entry) to "Manager" (managing a zone). Here is the required mindset for setting up this strategy:
Shift from Prediction to Range Definition
Don't ask: "Will the price go up or down tomorrow?"
Ask instead: "What is the price range the asset is unlikely to break out of in the coming weeks?"
Your primary job is to define the Grid Top Price (Ceiling) and Grid Bottom Price (Floor). As long as the price stays within this "Arena," the strategy will continue to execute trades.
Embrace Volatility as Fuel
For a trend follower, chop/sideways action is a nightmare. For a Grid Trader, it is fuel. Every time the price crosses a grid line down, it builds inventory. Every time it crosses back up, it realizes profit. You want the price to wiggle as much as possible within your defined boundaries.
Capital Allocation & Survivability
The biggest risk in grid trading is the price crashing below your Grid Bottom Price .
Mindset Check: Before launching, assume the price WILL drop to your bottom price immediately. Can your account handle that drawdown?
The script includes leverage and capital percentage inputs to help you size your position correctly. Never allocate 100% of your capital to a tight range without understanding the liquidation risk.
█ HOW IT WORKS
Grid Construction:
The script divides the space between your Upper Border and Lower Border into specific levels based on the Grid Quantity .
- Arithmetic: Equal spacing between lines (Standard).
- Geometric: Spacing based on mathematical ratios (useful for wider ranges).
Execution Logic:
- Entry: When price crosses below a grid line, a Long position is opened.
- Exit: When price bounces back up by a specific number of grid levels (defined by "Distance of TP"), the specific position is closed for a profit.
Time & Backtesting:
You can set specific Start and End Times . This allows you to backtest how the grid would have performed during specific historical volatility events before deploying it on live markets.
█ VISUALIZATION DASHBOARD
To keep you informed without cluttering the chart, the script features an information table at the bottom right:
Cash Out: Total realized profit booked into the account.
Open Position: How many grid levels are currently active (holding bags) vs. total levels.
Open Trade: The current floating P/L of held positions (Unrealized).
Max Drawdown: The deepest drawdown the strategy experienced during the test period.
RISK DISCLAIMER
Grid trading involves significant risk, particularly in strong trending markets that break out of your range against your position. This strategy does not use a stop-loss per trade; it relies on the user defining a safe "Bottom Price" and allocating capital accordingly. Past performance in backtesting does not guarantee future results. This script is a tool for execution and analysis, not financial advice.

Simple Grid Trading v1.0 [PUCHON]Simple Grid Trading v1.0
Overview
This is a Long-Only Grid Trading Strategy developed in Pine Script v6 for TradingView. It is designed to profit from market volatility by placing a series of Buy Limit orders at predefined price levels. As the price drops, the strategy accumulates positions. As the price rises, it sells these positions at a profit.
Features
Grid Types : Supports both Arithmetic (equal price spacing) and Geometric (equal percentage spacing) grids.
Flexible Order Management : Uses strategy.order for precise control and prevents duplicate orders at the same level.
Performance Dashboard : A real-time table displaying key metrics like Capital, Cashflow, and Drawdown.
Advanced Metrics : Includes Max Drawdown (MaxDD) , Avg Monthly Return , and CAGR calculations.
Customizable : Fully adjustable price range, grid lines, and lot size.
Dashboard Metrics
The dashboard (default: Bottom Right) provides a quick snapshot of the strategy's performance:
Initial Capital : The starting capital defined in the strategy settings.
Lot Size : The fixed quantity of assets purchased per grid level.
Avg. Profit per Grid : The average realized profit for each closed trade.
Cashflow : The total realized net profit (closed trades only).
MaxDD : Maximum Drawdown . The largest percentage drop in equity (realized + unrealized) from a peak.
Avg Monthly Return : The average percentage return generated per month.
CAGR : Compound Annual Growth Rate . The mean annual growth rate of the investment over the specified time period.
Strategy Settings (Inputs)
Grid Settings
Upper Price : The highest price level for the grid.
Lower Price : The lowest price level for the grid.
Number of Grid Lines : The total number of levels (lines) in the grid.
Grid Type :
Arithmetic: Distance between lines is fixed in price terms (e.g., $10, $20, $30).
Geometric: Distance between lines is fixed in percentage terms (e.g., 1%, 2%, 3%).
Lot Size : The fixed amount of the asset to buy at each level.
Dashboard Settings
Show Dashboard : Toggle to hide/show the performance table.
Position : Choose where the dashboard appears on the chart (e.g., Bottom Right, Top Left).
How It Works
Initialization : On the first bar, the script calculates the price levels based on your Upper/Lower price and Grid Type.
Entry Logic :
The strategy places Buy Limit orders at every grid level below the current price.
It checks if a position already exists at a specific level to avoid "stacking" multiple orders on the same line.
Exit Logic :
For every Buy order, a corresponding Sell Limit (Take Profit) order is placed at the next higher grid level.
MaxDD Calculation :
The script continuously tracks the highest equity peak.
It calculates the drawdown on every bar (including intra-bar movements) to ensure accuracy.
Displayed as a percentage (e.g., 5.25%).
Disclaimer
This script is for educational and backtesting purposes only. Grid trading involves significant risk, especially in strong trending markets where the price may move outside your grid range. Always use proper risk management.
